Goalpost ®
Track and Improve Enrollment, Graduation and Retention Rates.
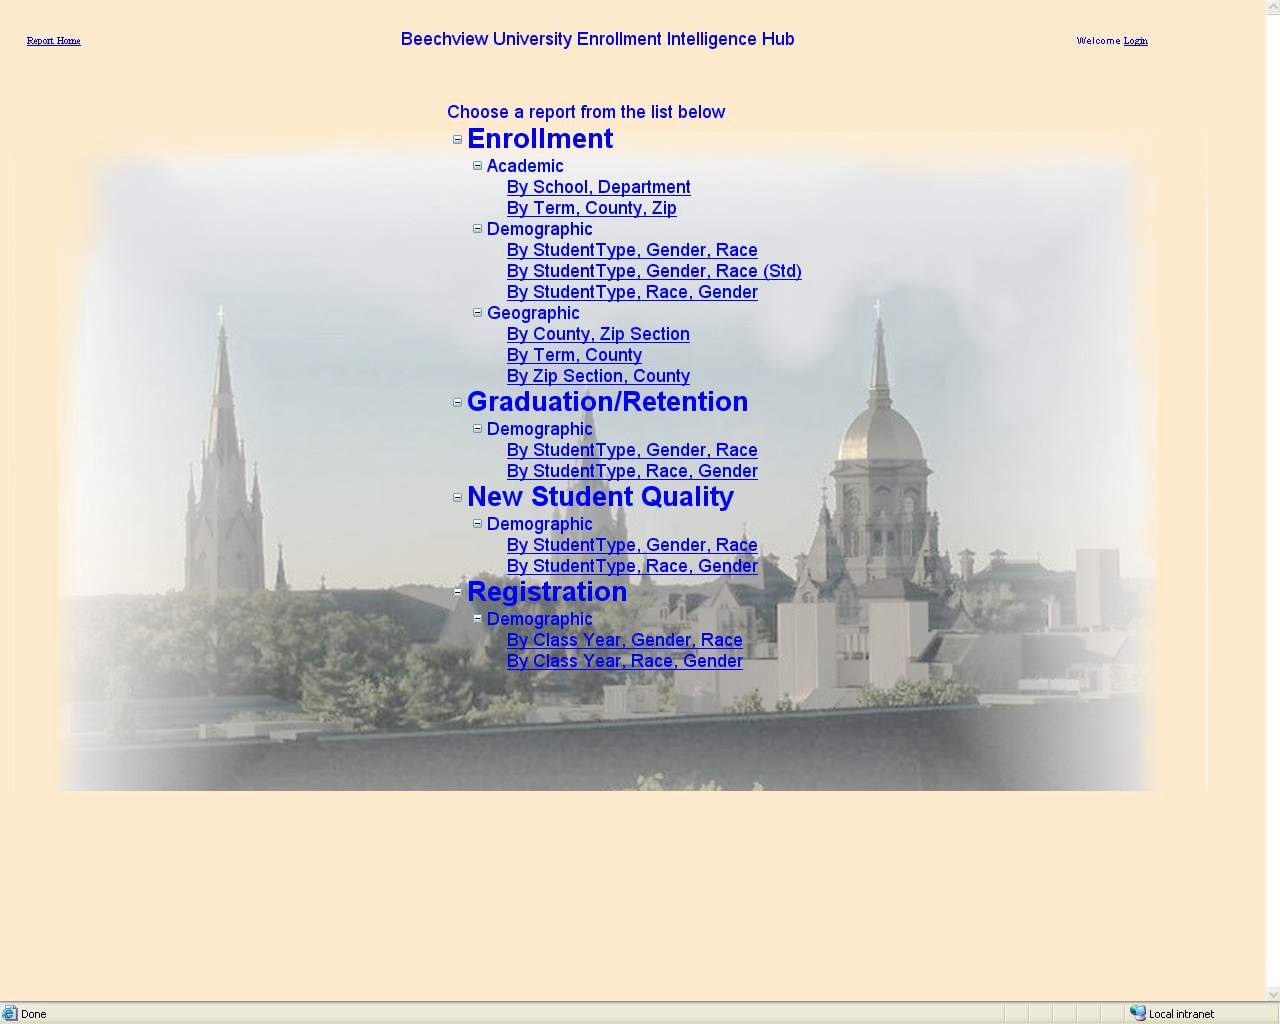
Click here to view the video demo - about 7 minutes long (allow 30 seconds to load).
Key Benefits
-
Provides for fact-based decision making to improve:
-
Enrollment
-
Graduation rates
-
Retention rates
-
Persistence
-
Recruitment
-
Enrollment
-
Allow all levels of the
institution to see fresh data daily
-
President
-
Provosts
-
Deans
-
Department Heads
-
Institutional Research
-
President
-
Define KPIs (Key Performance
Indicators) that are meaningful for your institution. Samples
include
-
Applications
-
Enrollments
-
Deposits
-
High School GPA
-
High School Class Rank
-
SAT Score
-
ACT Score
-
etc. etc. etc.
-
Applications
-
Look at data segmented by any
combination of various dimensions such as:
-
Gender
-
Ethnicity
-
Campus
-
College
-
Department
-
Major
-
State
-
County
-
High School
-
etc. etc. etc.
-
Gender
-
Eliminate cutting/pasting and
labor intensive report creation - stop reinventing the wheel!
-
Consolidate dozens of
paper-based reports into one interactive data-based, web-based
report.
-
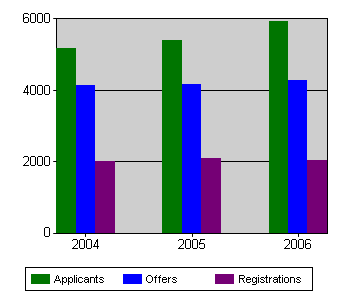
Dynamic and colorful tables,
charts and graphs.
-
Simple and easy interface.
-
Makes use of data that you
already have.
-
Light-weight, low-cost
solution for all multi-dimensional OLAP and cube-based
reporting.
-
Click Here to see how Goalpost solves enrollment reporting
problems for academic institutions


